Tutorial
Comparing monthly results with the monthly average using FIXED LOD in Tableau
Comparing monthly results with the monthly average using FIXED LOD in Tableau

How to use the FIXED LOD calculation to compare data in Tableau?
In this tutorial, I'd like to explain how to use the FIXED LOD calculation in Tableau to compare a company's past performance with a monthly average.
To start with the analysis, we import a diverse data source that dates back at least four years into Tableau. To prevent further conflicts, we use a well formatted data source. If your data source isn't formatted correctly, you might want to use Tableau Prep to clean it up before we start.
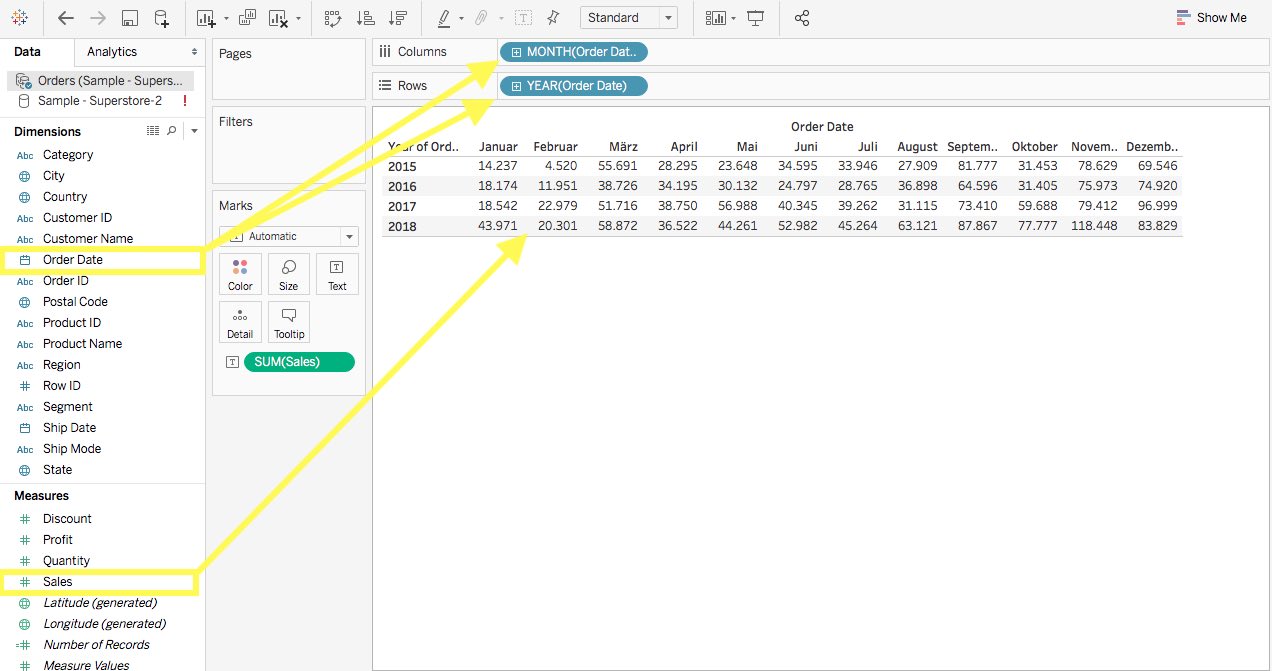
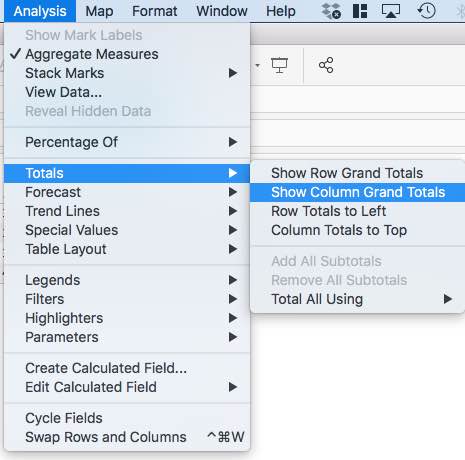
Now we can get started. Add the order date on row and collumn and drag sales on "Text". Make sure that one order date is set to the years, while the other one is set to months. Once that is done, you should be able to see the exact monthly values of your data source. To calculate the monthly average of those four years, you need to activate the Grand Total in Tableau. For this select the tab "Analysis" and make your selection in "Totals".
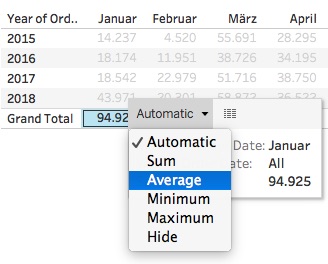
After that, switch the Grand Total to average.
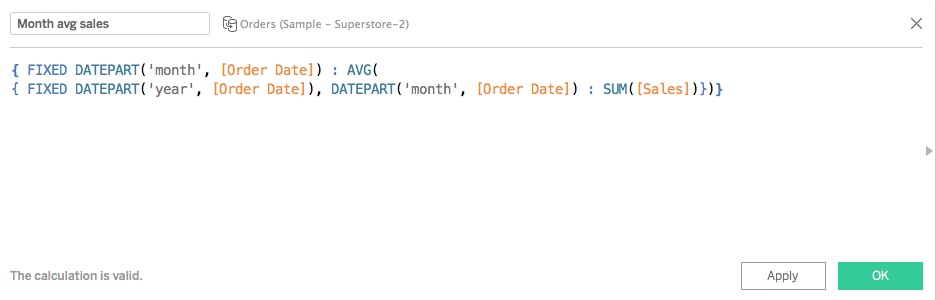
Now you can get started with your first FIXED LOD to visualize monthly sales in relation to the average monthly performance. Create a field with the following FIXED calculation:
{ FIXED DATEPART('month', [Order Date]) :
  AVG({ FIXED DATEPART('year', [Order Date]), DATEPART('month', [Order Date]) : SUM([Sales])})
}
For the fields that include DATEPART, you can drag and drop the dimensions that you already added to the column and row right into the calculation. It is important that you pay special attention to the parentheses here, which can be easily confused at the end of the calculation.
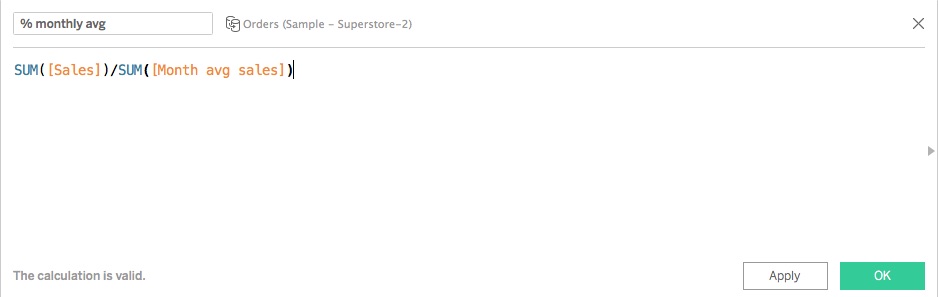
You can then add this value to your table to calculate the difference to the monthly average for each month. For that you'll also need to create another calculated field. Insert the following calculation:
SUM([Sales]) / SUM([Month avg sales])
This basically tells Tableau to divide your sales by the monthly average. That way you'll get to see the variance.
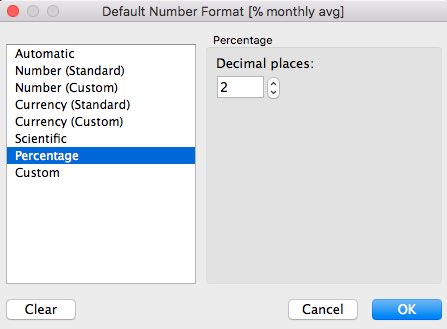
After that, change the formatting by right-clicking on the calculated field. Select the percentage here and set the decimal places to 1.
To make the differences to the monthly average clear, you should remove all fields from the worksheet, except for the calculated field that shows the variance and the order data.
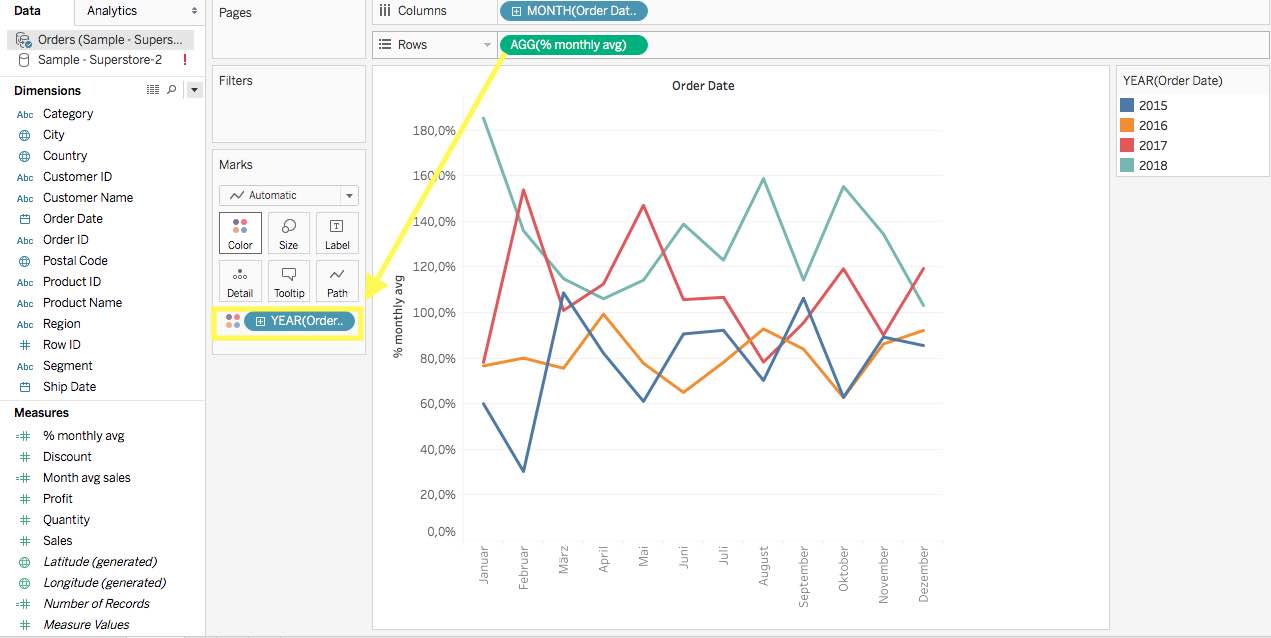
To visualize the percentages, you can add the calculated value to the tabs "Rows" or "Columns".
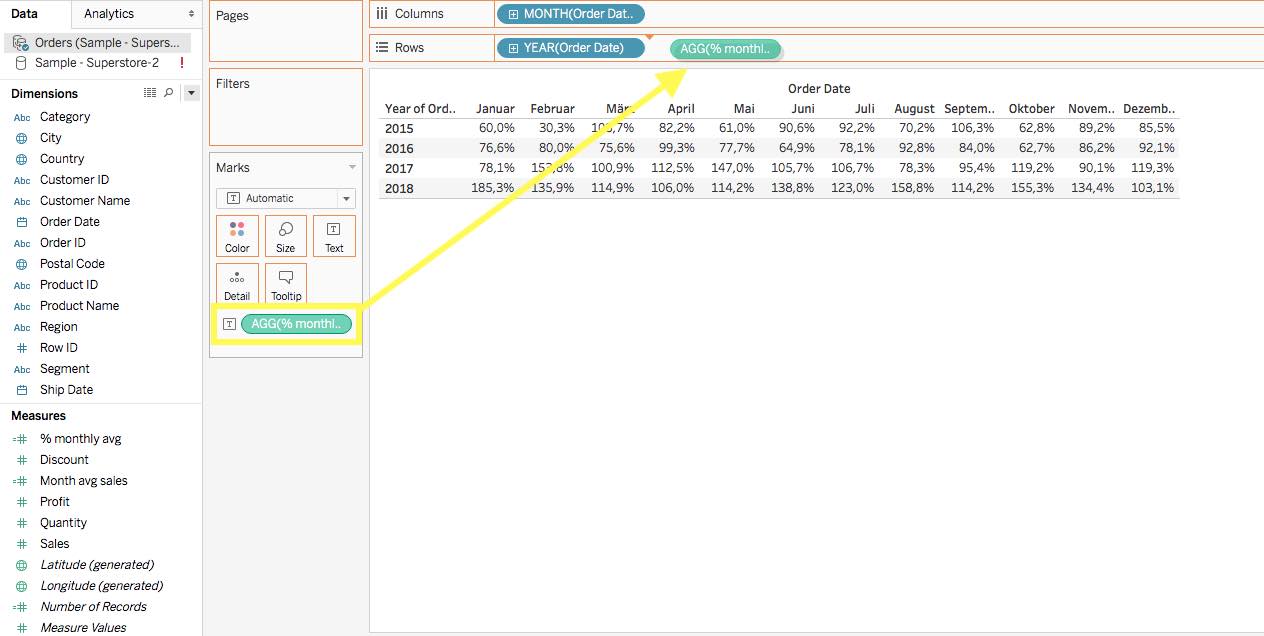
The following visualization is quite interesting:
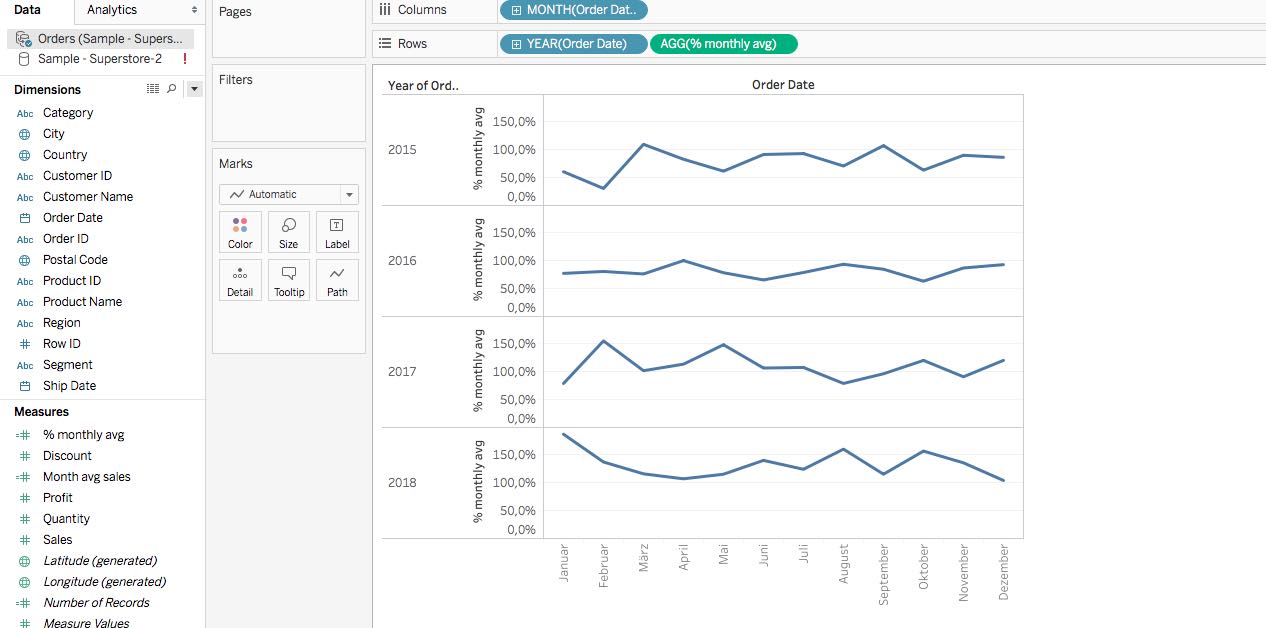
But you can still not really interpret the differences in monthly performance. To change this issue, just drag the "Year" field to Color. Then Tableau should compare the months with each other. A legend on the page gives information about the graphs.
To improve the readability of the individual values, you should set up a mean value at 100%. This would be advantageous in order to better analyze the individual graphs in their deviation from the average. For this, just create another calculated field and fill it with the following calculation:
[% monthly avg] - 1
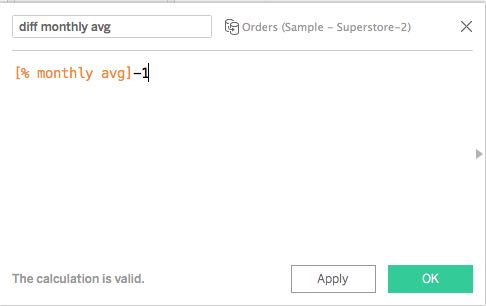
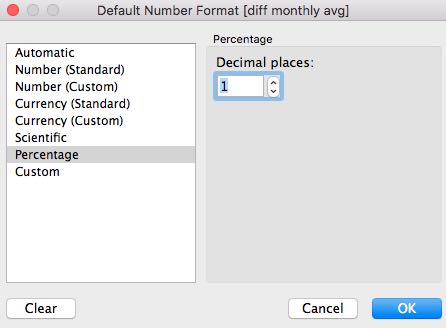
Tableau now just needs to know that you want to display a percentage. Therefore, you need change the format of the calculated field with a right-click and set the decimal places to 1.
Add the calculated field to your worksheet, move it into the sector "Columns" and Tableau will show two graphs. The first graph displays the monthly average. Your second graph represents the difference to the monthly average of each month. The visualizations of individual data can also be changed in the "Tooltip" section in Tableau.
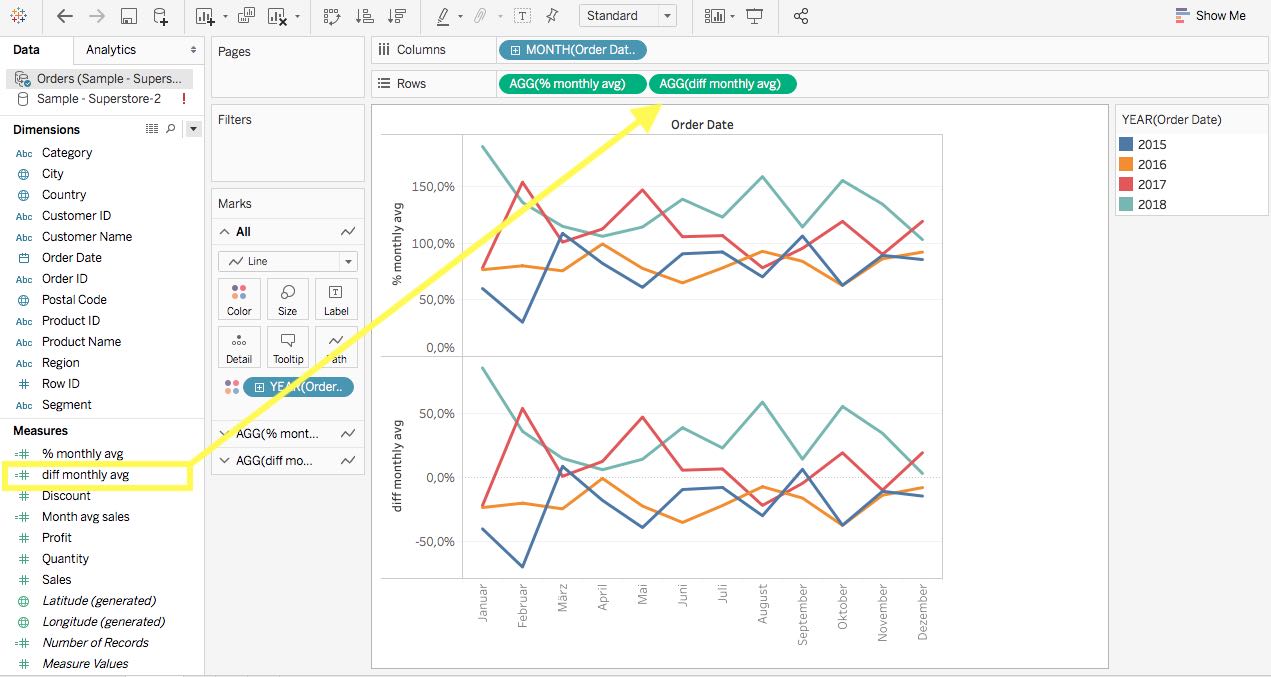
This is the final result for the monthly FIXED LOD calculation in Tableau.
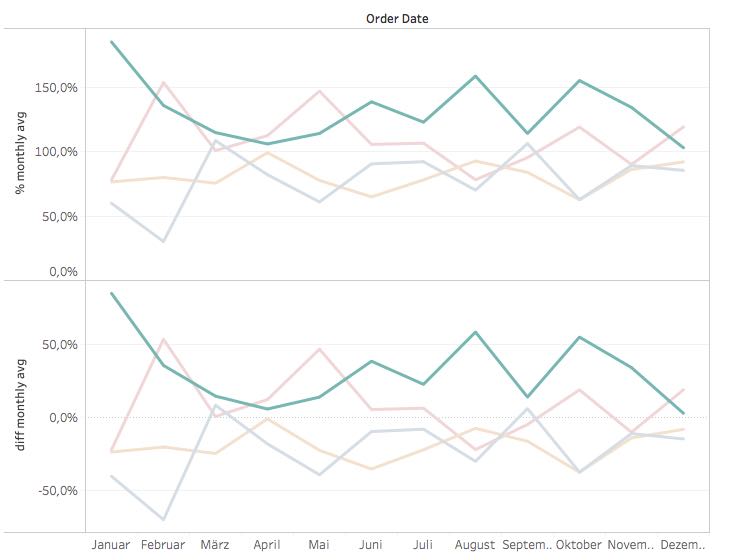
In this sample VIZ you can see that the year 2018 is one of the most consistent. It is also the year with the most turnover of the last four years. Especially the January was significantly stronger than the last four years results and seems to have laid the foundation for a successful year.