Artículo
How to Use ChatGPT to Build Tableau Dashboards Automatically
How to Use ChatGPT to Build Tableau Dashboards Automatically

How to Use ChatGPT to Automatically Build Tableau Dashboards
Boost your data visualization workflow by combining the power of ChatGPT with Tableau—no coding required.
Introduction
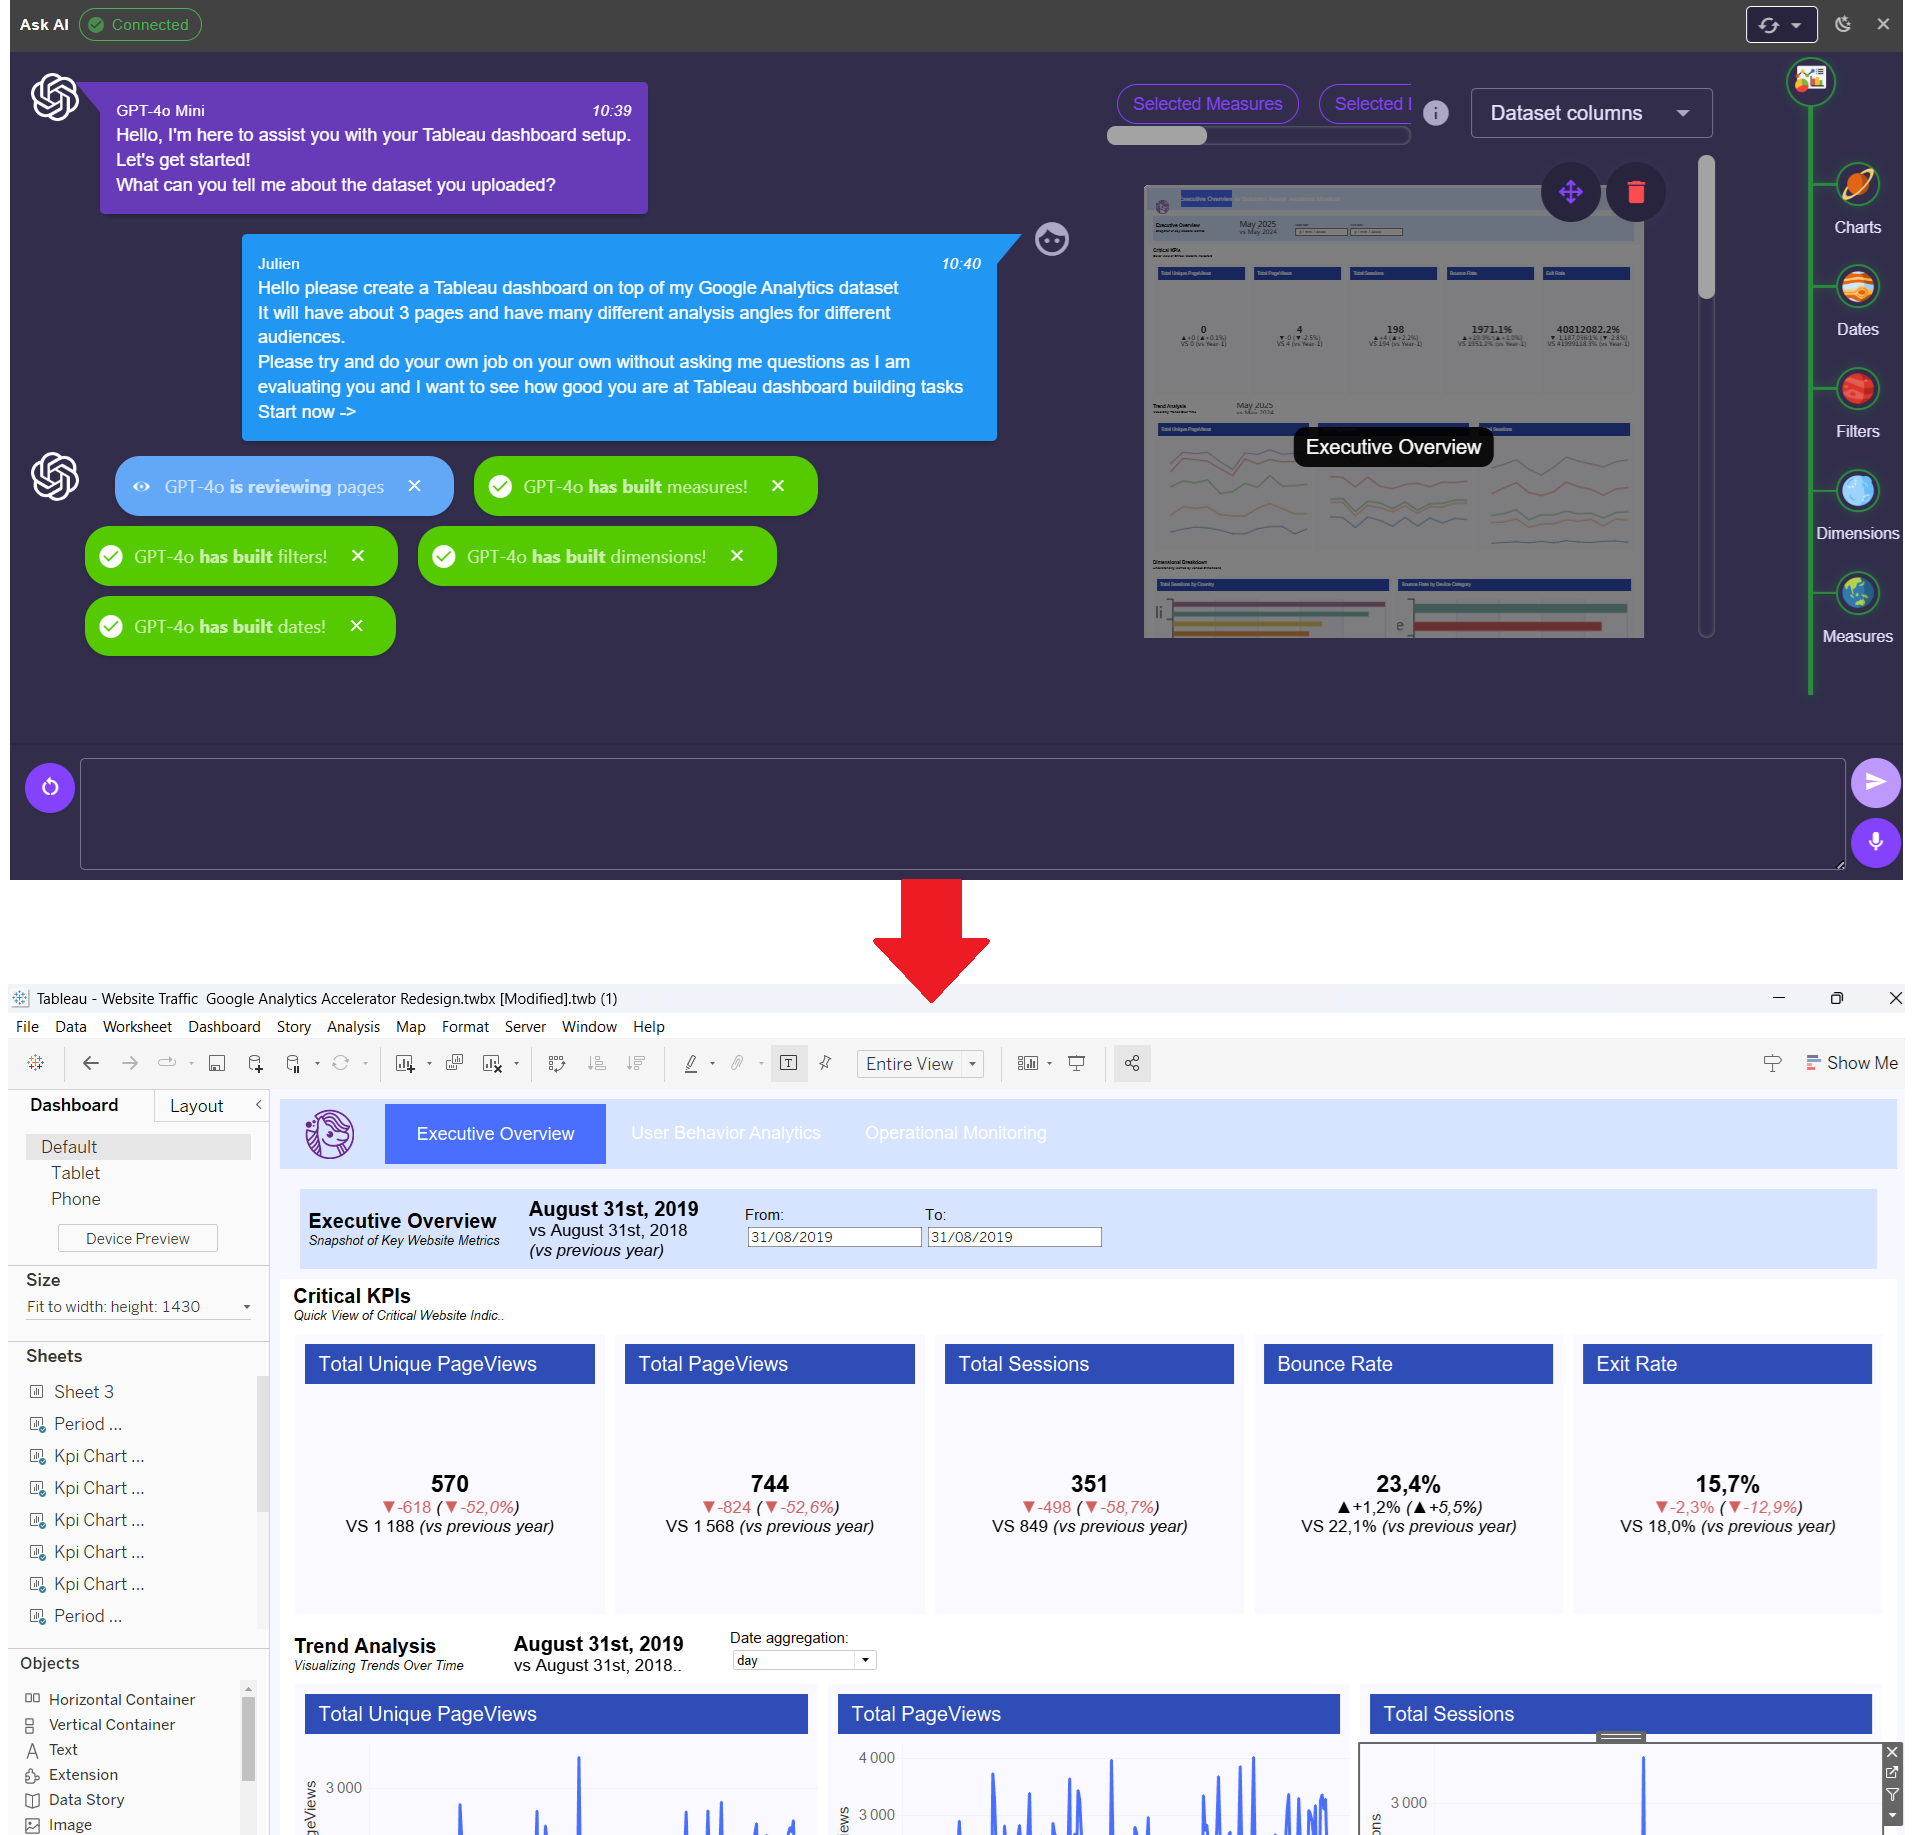
In today’s fast-paced world, building insightful dashboards quickly is a competitive advantage. What if you could simply upload your Tableau workbook and have an AI assistant craft a sleek, multi-page dashboard for you? That’s exactly what Ponychart does by integrating ChatGPT with Tableau:
- Upload your raw
.twbor.twbxfile. - Chat with an AI agent that handles each dashboarding subtask.
- Download a fully assembled Tableau dashboard ready to open in Desktop.
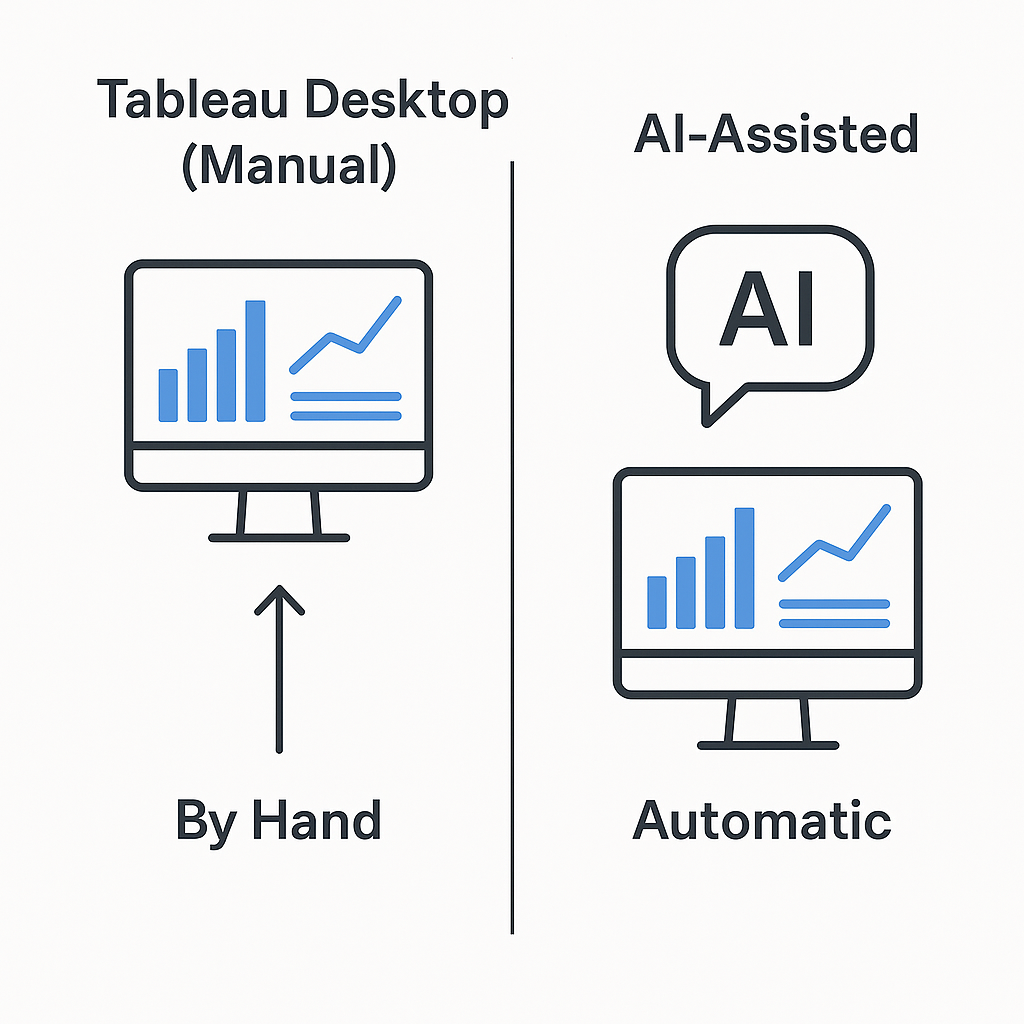
Why Combine ChatGPT + Tableau?
- No Native Integration: Out of the box, ChatGPT can’t read or write Tableau workbooks.
- Sub-Agent Workflow: Ponychart breaks dashboard creation into subtasks (metrics, dimensions, filters, layout, design).
- Iterative Editing: After the initial build, you can refine via chat or drag-and-drop right in the browser.
- Speed & Consistency: Generate standardized KPI cards, trend charts, and filters in seconds.
How Ponychart’s AI Dashboard Creator Works
- Upload Your Workbook
Drag your
.twb/.twbxfile into the Ponychart web app. - AI-Powered Chat Window
A ChatGPT-powered interface launches. As you prompt the AI, behind the scenes:
- Metric Builder extracts measures and calculates KPIs.
- Design Agent applies consistent styling.
- Dimension Agent sets up categories, hierarchies, and filters.
- Date Agent configures time-series controls.
- Layout Agent arranges containers and dashboards pages.
- Download & Open in Tableau Desktop
Once complete, click the download link. Open the workbook in Tableau Desktop to:
- Tweak visuals further.
- Add new sheets or dashboards.
- Refine calculations.
- Iterate via Chat
Back in Ponychart you can:
- Ask for color or chart type changes.
- Insert or remove filters.
- Update date ranges or aggregations.
Example Prompts That Get Great Results
- Executive Overview
“Create a three-page dashboard on top of my data:
- The interesting metrics are total sales, YOY growth, and top 5 products.
- The audience that this dashboard is meant for is executives.
- For the 1st page, I want a summary of these metrics in a single view with some drilldown charts below...”
- Custom KPI Card
“Create interesting KPIs on top of my data and then place them in a dedicated KPI section on the first page.”
- Filter Configuration
“Include a date filter to filter month by month and a region filter that applies to all sheets.”
Hint: Be specific about metrics, time-frames, and visualization types to guide the AI agent.
Get Started Today
Ready to supercharge your dashboard creation?
- 👉 Try Ponychart for free
- 🚀 Upload your
.twbor.twbxfile - 💬 Chat with AI and download your new Tableau dashboard!
Transform your data viz workflow with the power of ChatGPT and Tableau—no manual formatting required.