Tutorial
Tutorial B : Period bands for period over period analysis in Tableau
Tutorial B : Period bands for period over period analysis in Tableau

This tutorial is part of a series of tutorials on period over period analysis in Tableau. You can find the previous tutorial here: Period over period comparison cards in Tableau
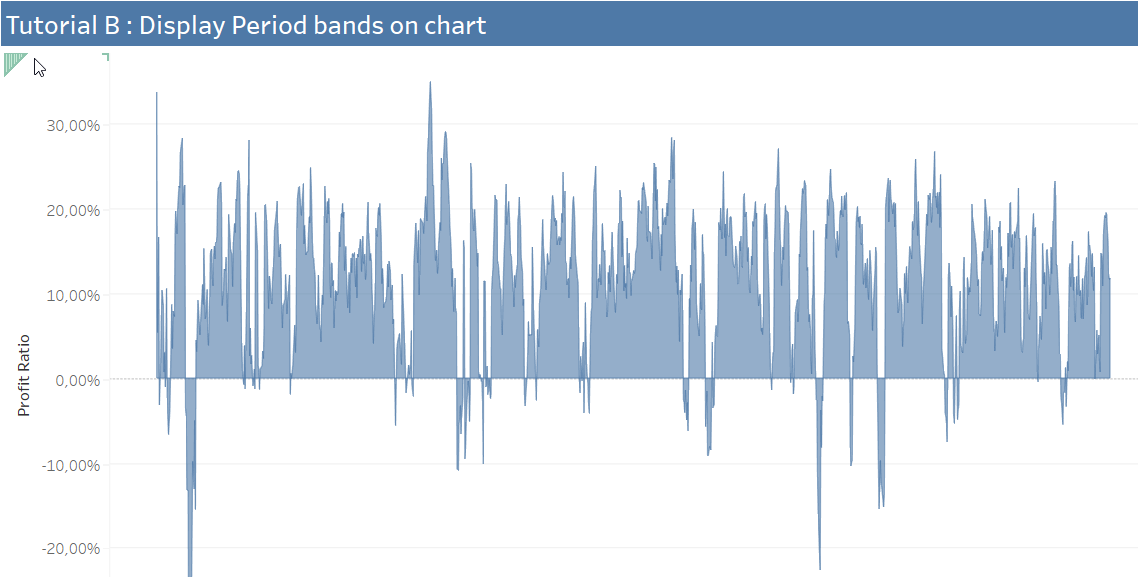
When dealing with period over period comparisons in Tableau, it is often useful to display the periods involved to the user. This is typically easily done with grey bands on a line chart to show the periods involved. In this tutorial, we will see how to build such a chart (part B of the following dashboard).
1/ Define a reference period and comparison period with Parameters
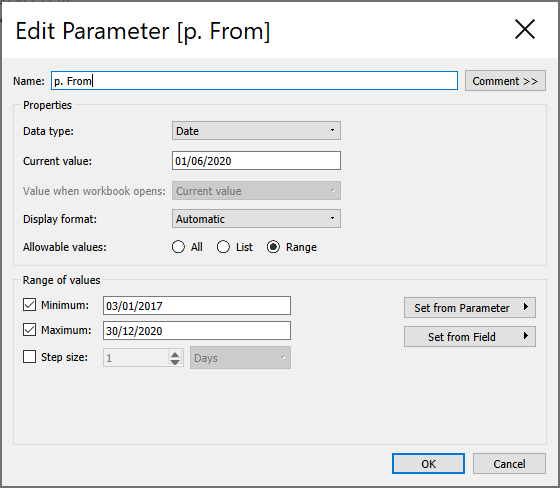
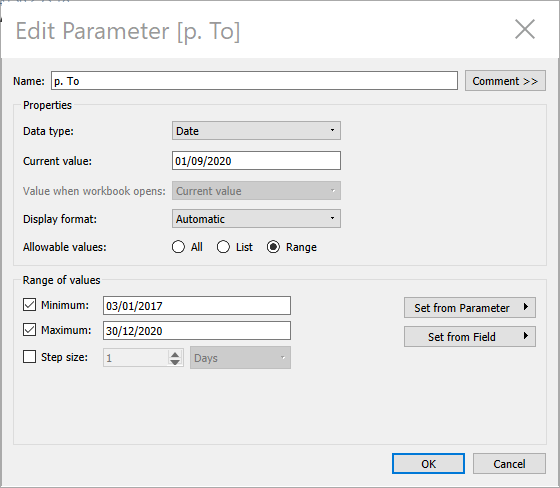
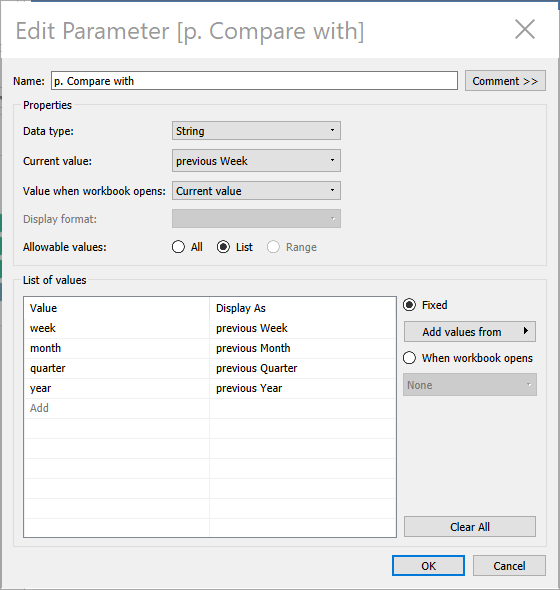
Here we will assume you followed Part A of this tutorial series and have 2 parameters [p. From] and [p. To] as fo to define the reference period and a parameter to define the comparison period [p. Compare With].
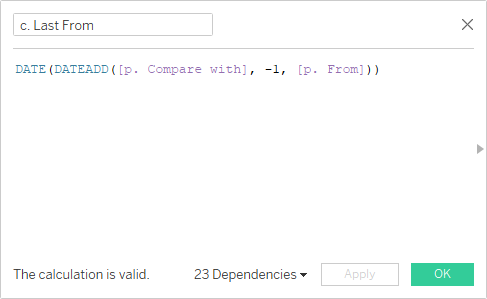
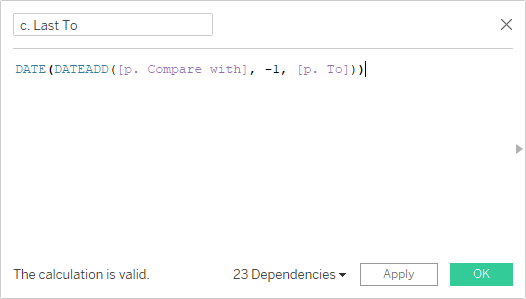
We will also assume you have created the associated calculations [c. Last From] and [c. Last To] which are the extremum dates of the comparison period.
2/ Create a trended line chart
Drag your date field to the columns shelf and your KPI to the rows shelf. You should get a line chart with a trend over time.
3/ Create the reference period band & the comparison period band
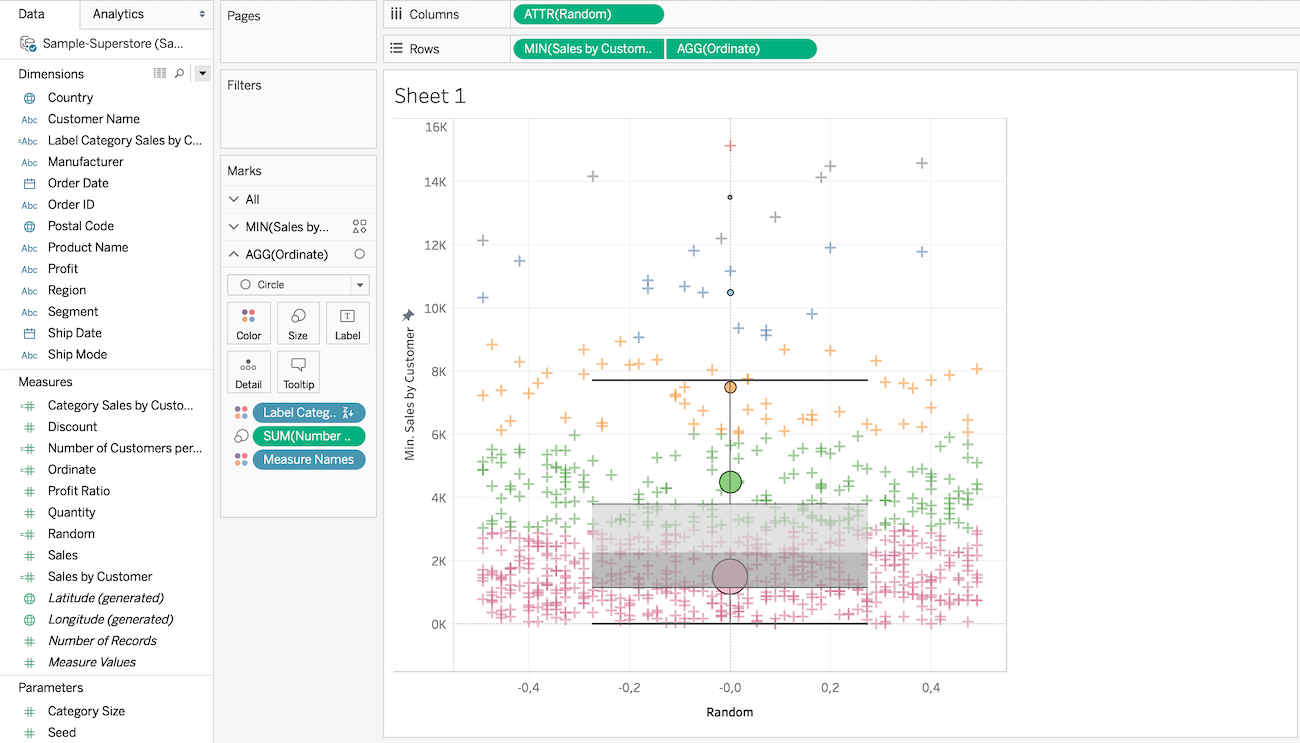
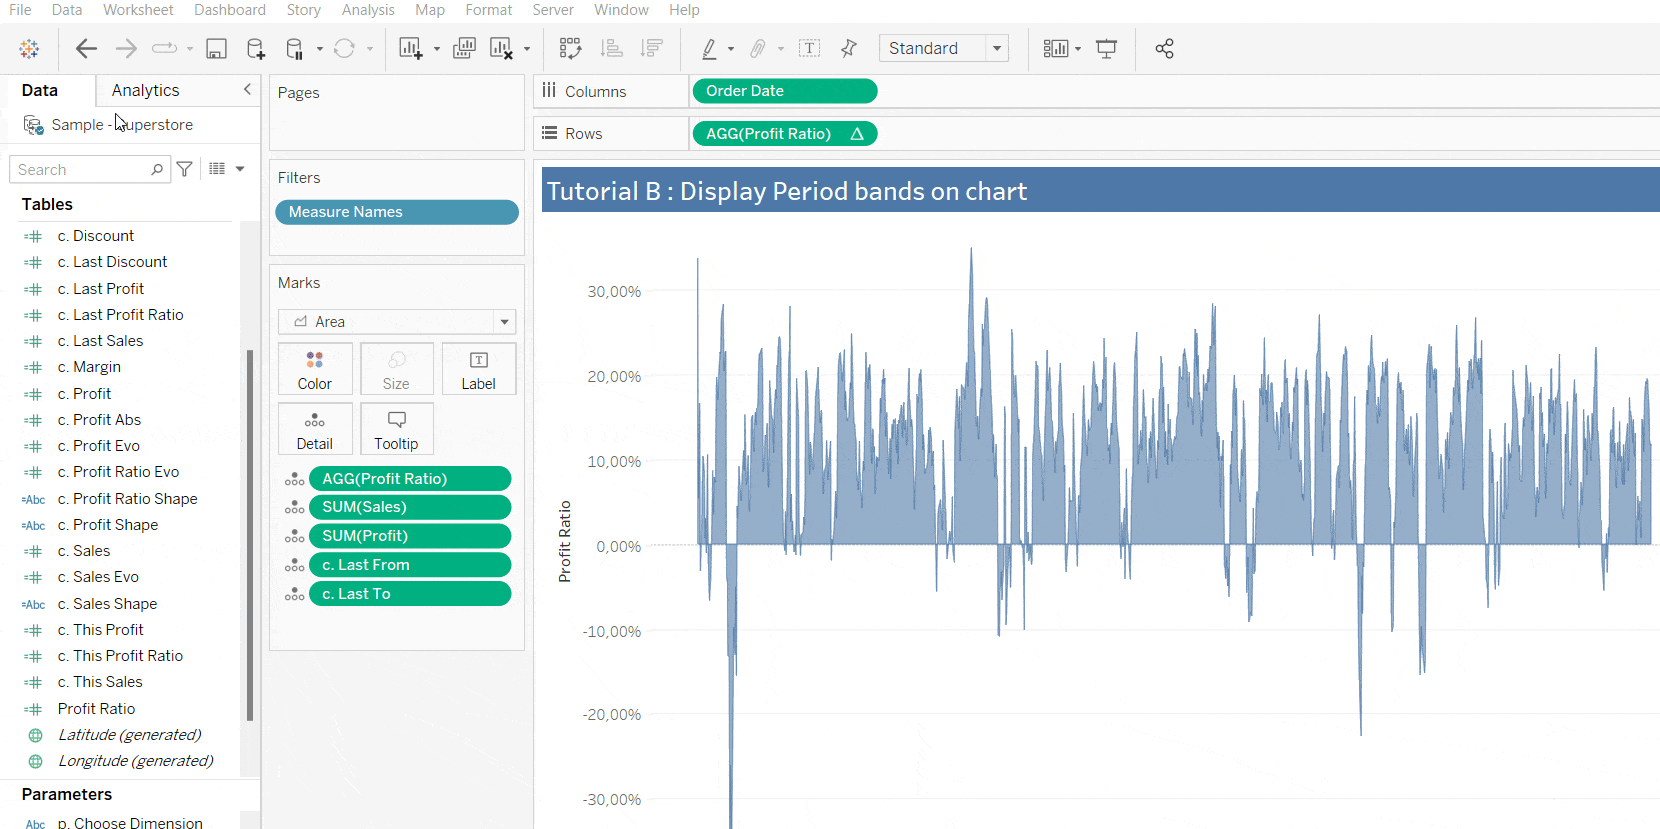
Since we want to display bands for each extremum dates, we will need to add the date fields ([c. Last From] and [c. Last To]) to the detail shelf.
- Since they are ordinal date fields, it is most likely that Tableau will display them as discrete fields. You can right click on the date field and select continuous to make sure it is continuous.
- Then drag the date fields to the detail shelf.
- Tableau assumes you want to aggregate the date field as YEAR but we want to keep the date field as is. You can right click on the date field in the detail shelf and select Exact Date.
Here how it should go :
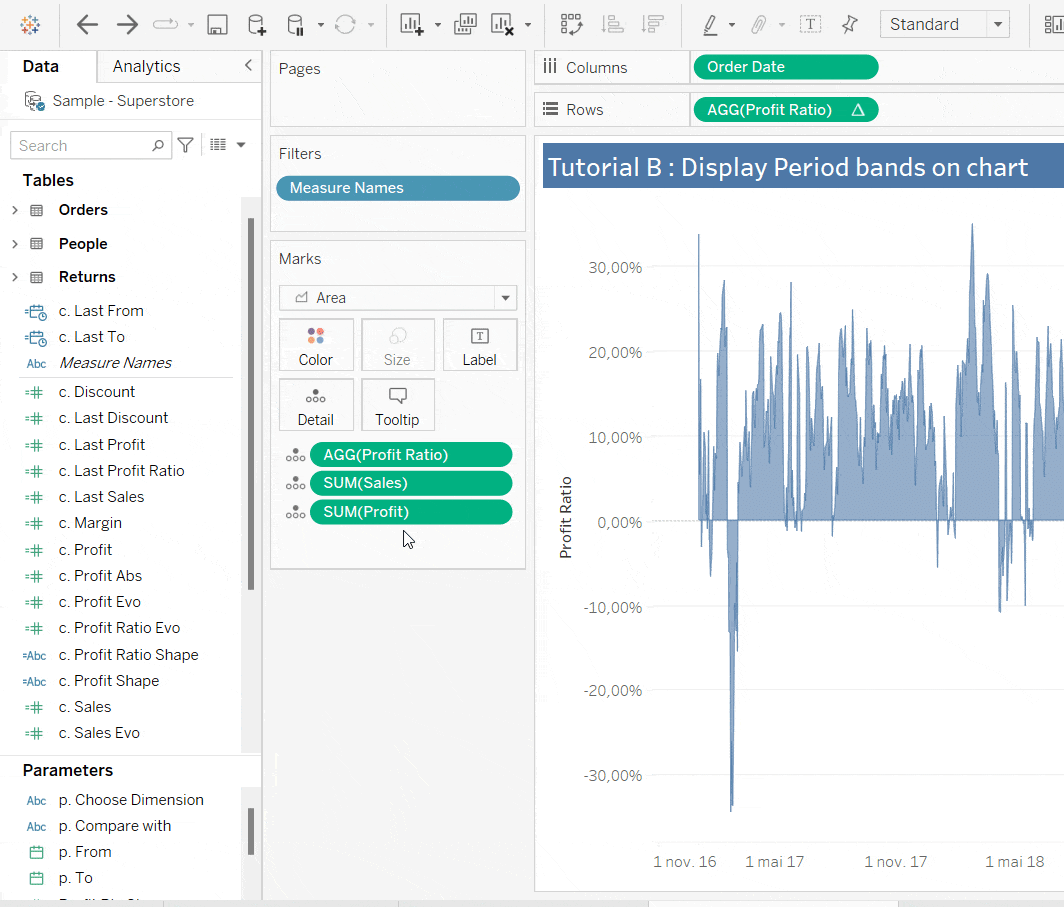
Now go to the Analytics section to the top left of the screen and drag a Reference Band to the view (on the date field in our case [Order Date]).
- Right click on the reference band and select Edit. For the Band From attribute, select [p. From] and for the Band To attribute, select [p. To].
- Remove any Label or Tooltip by setting them at None.
- Repeat the same process for the comparison period band. For the Band From attribute, select [c. Last From] and for the Band To attribute, select [c. Last To].
Here is how it should go :
And that's all there is to it ! If you found this tutorial interesting, here is the 3rd part of the tutorial series on period over period analysis in Tableau : Period over period comparison Bubble Chart in Tableau